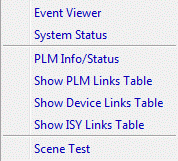
ISY-99i/ISY-26 INSTEON:Tools Menu
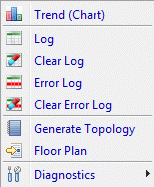
Trend (Chart)
Once you select this menu you must wait a few seconds. You will be presented with the chart window (see Figure 16) which offers multiple trending and charting options for each device, for a group of devices or for all the devices linked to ISY. This operation performs the same action as the Trend (Chart) button on the tool bar ().
Trend - Categories Menu
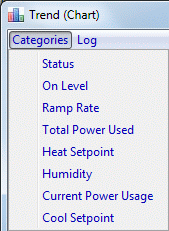
The Categories menu allows you to choose which attribute is charted. Currently, the following categories are supported:
- Status – the status of the device charted in time
- On Level - the On Level of the device charted in time
- Ramp Rate – the Ramp Rate of the device charted in time
- Total Power Used - select your power monitor
- Heat Setpoint - select a thermostat
- Humidity - select a thermostat
- Current Power Usage - select your power monitor
- Cool Setpoint - select a thermostat
After you select a Category the group menu will open. This menu will display each device and every group available in ISY.
Trend - Log Menu
Selecting this menu brings up a Confirm requester. Selecting Yes will open a Windows Excel window. Clicking on No will open a file requester and will save the log as a comma seperated value (CSV) file. Most database programs can read CSV files.
When opening the log in Excel you will be requested to allow macros to run. You must select OK for the macro to run and to have access to the log file. The log file contains the date and category intersections for all the devices linked to ISY.
If your log file is empty you probably don’t have macros enabled. To enable macros:
- Click on the Tools menu
- Select Macros
- Select Security and choose Medium for level
See Viewing_the_Log_file.
Log
This menu is the same as above, the Trend – Log Menu option.
See Viewing_the_Log_file.
Clear Log
This menu allows you to reset the information captured in the log file. The information already captured will be deleted and the log will restart from this point of time. Once you select this option you will be presented with a confirmation dialog. You may select OK to proceed and delete the logs or Cancel to exit without deleting the logs.
Error Log
The ISY will produce a .csv file of errors it has recorded.
See Viewing_the_Log_file.
Clear Error Log
Will delete the error log in the ISY memory.
Generate Topology
This menu allows the user to document the network topology. It generates an HTML file that contains the list of all the device name, address, type, properties, links and scenes. This list is useful for troubleshooting the network or simply as a reference.
Floor Plan
This menu provides a graphical representation of the location of each device. It allows you to create locations (rooms) and place devices in their physical location. This will help if at a later time you would like to know where the specific device you are controlling is located. Once you select this option you will be presented with the floor plan window (see Figure 17).
There are two options for creating a physical location:
- By clicking on the “New Location” icon at the top (
).
- By dragging and dropping an existing scene from the Navigation Pane
After creating a physical location, you can drag and drop devices from the Navigation Pane directly into any location on the Floor Plan’s Window. Devices which are dropped into the Floor Plan maintain their relationships and, as such, clicking on any of the controlling (master) devices on the Floor Plan highlights the associated responders with the Floor Plan. Also, each device has its state captured as part of its name (i.e. Hall1[off]). This operation performs the same action as the Floor Plan button on the tool bar ().

Diagnostics
Click on Event Viewer for detailed information about this feature.
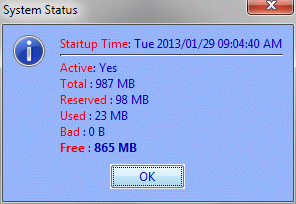
System Status
Displays information concerning memory usage in the ISY.
PLM Info/Status
This will open a simple requester to display the Insteon address and the status of the connection between the PLM and the ISY.
If the address is displayed as 0.0.0 and the message says Not connected there is a problem with the PLM or the cable between the PLM and the ISY.
Show Links Table
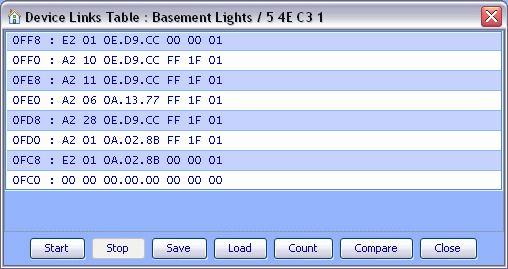
- Pressing Start will open a requester with a list of devices to choose from (except on the PLM).
- Save and Load will open a file requester. The file is plain text.
- Count will display the number of links found.
- Compare will compare a Device Links Table with the ISY Links Table and note any differences.
The data is organized this way:
First four digits = the database address in hexadecimal digits
Next pair:
     E2 = controller
     A2 = responder
     22 = deleted
     02 = deleted
     00 = EOF (End Of File)
Followed by:
     Group#
     Linked address
     Response (level)
     Ramp Rate
     Data3 (unused)
Scene Test
If you suspect poor communication with some devices you can use this test.
- Select a scene which contains those devices and press the On button. Visually ensure that all devices are turned on.
- Use the Menu to Select Tools/Diagnostics/Scene Test. This will open a requester with a list containing all your scenes.
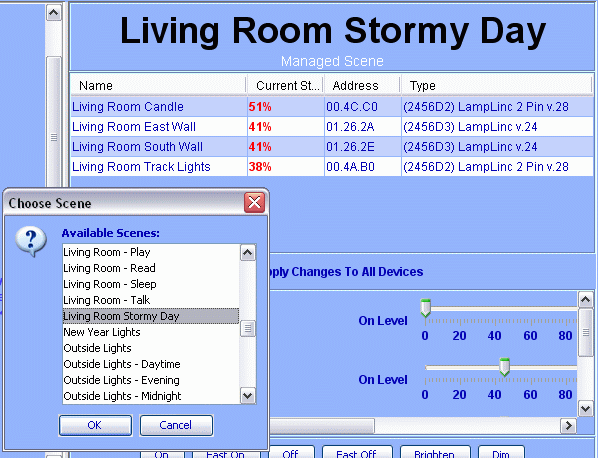
- When you click OK Scene Test will send a group broadcast Off and observes the results.
- If ISY receives the group clean up ACK, then you can be sure that this scene will work reliably.
- The results are displayed in the Event Viewer which will open automatically.
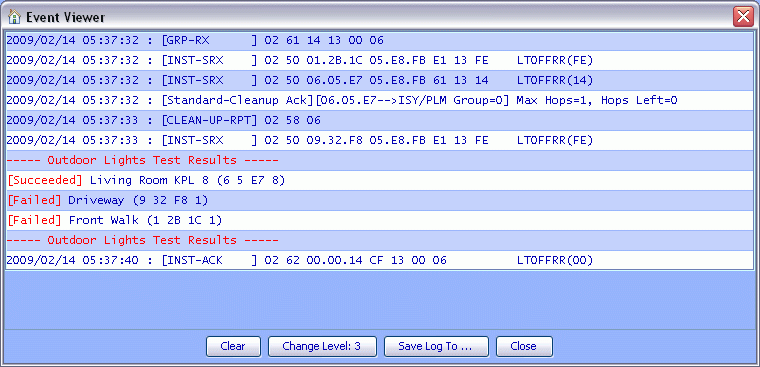
FYI
- The group command is sent with a 1 hop limit instead of the usual 3 hops. Then it watches the cleanup commands for acknowledgments. If the device received the group command it sends an ACK, if not the device returns a NAK. A device will also be marked as Failed if it fails to respond within the default ISY timeout for a response (currently 4 seconds). This tests a worst case scenario for communication between the devices and the PLM.
- If the group command fails the devices may still respond to the cleanup commands. If you observe the lights in the scene any that pass the test will respond immediately, devices that return a NAK will respond when the cleanup commands are sent and you will observe a delay in the response. Devices that don't respond at all will probably not react.
- Note in your observation this is not a FastOff command and the test will use the ramp rates assigned to the scene. Long ramp rates may not appear to show immediate changes in the device levels.
